Like it or not, business is a game—well, that’s how I see it. The leadership team of a business defines and sets the boundaries, the rules, the players and the length of play. Simon Sinek writes about this concept in his latest book, The Infinite Games. He specifically states that, ‘There are no winners or losers in an infinite game; there is only ahead and behind’. It’s a powerful and useful reframe to our general daily competitive mindset around sales growth targets, cost reduction targets, throughput improvements targets (the list is endless), that drives the win-lose mindset in businesses.
However, targets, competitiveness and challenging one another certainly do help. These are the fundamental principles behind growth and progression—both personally and in business. So, why not play mini-finite games within our infinite business game? The question then becomes: how do we play a finite game within an infinite game?
There are individual games within the Olympics. Individual books within a series. Then there are individual episodes within a drama and individual days, weeks and months in a lifetime. The smaller components within such metaphors can have a finite outcome: a winner, a specific ending, a measured success. However, the latter is an open-ended infinite game (in Sinek’s language). So, let’s think about how we gamify our infinite business game into smaller chunks?
The trick is to provide meaningful metrics for teams, departments and business units to measure whether they are ahead or behind at any given time: hourly, daily, weekly, monthly, quarterly and annually. Many teams are disengaged due to a loss of connection with the measures, which don’t provide them a sense of being ahead or behind. Therefore, we must create meaningful metrics for teams to play finite games within the entire infinite business game.
In my latest book, ADVANCE: 12 Essential Elements to Supercharge Productivity & Profitability, one of the chapters (elements) is Monitor Metrics that Matter. The simplified 3C’s framework (shown below) helps teams, departments and businesses to establish meaningful dashboards.
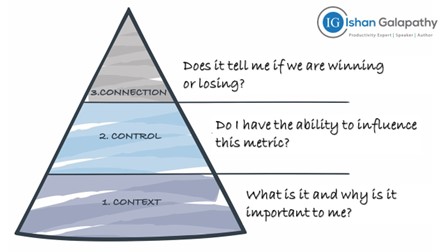
Context: Any person using visual information from a dashboard will try to answer three questions subconsciously: What is this? Is this important to me? Why should I care about it? Answering these questions will provide the context. Manufacturing companies commonly use safety, quality, productivity, cost, delivery and morale. It’s easy to provide a context around your safety, the quality of your work and the performance of your team.
Control: There’s little use in measuring and tracking something that individuals and teams feel they cannot control or influence. This is when they shrug their shoulders or become disinterested. So, for each attribute, find the metric that resonates with the team. For example, productivity can be measured with extreme simplicity of quantity produced for a given period or with medium complexity as a percentage of planned versus actual or with high complexity through an Overall Equipment Effectiveness (OEE) calculation (a percentage calculated by multiplying three other
percentages of availability, speed and waste). So, find the right level of maturity for the team.
Connection: Can your dashboard decipher if the team is winning or losing at a particular point in time? This is the most critical aspect of a dashboard and it is driven by the visual aspect. Can you gamify it with basic targets, stretched targets or the team’s personnel best targets (akin to personal best, Olympic records and world records)? Can you make it easier to read and understand by adding visual formats with clear targets? Can you make it playful with colours and highlighting continuous success streaks?
Simplicity is the essence that drives this process. My personal acid test is to check if the dashboard makes sense from five metres away and in less than five seconds. We can make this extremely complicated and get tangled up in using complex financial and business performance calculations—but there’s no need.
I remember from my corporate days, the ongoing effort required to standardise OEE calculations across sites, regions and countries. Such complicated calculations paved different paths for individual divisions to establish their own interpretations. It was a bit like the Duckworth–Lewis–Stern method used in cricket to calculate the target for a team batting second, when matches are affected by weather. No one knows how it’s calculated (other than Frank Duckworth, Tony Lewis and Steven Stern) and everyone has an opinion as to why their team is hard done by.
Work on first principles: keep them simple and be playful. That’s how you play a finite game within the infinite business game. As my good friend Bernard Desmidt often says, ‘You’ve got to hold it tightly with an open hand’.
How are you playing your business game?